In my last post I detailed my trades over the previous six months. In summing them up I noticed that I had traded both Amazon (NASDAQ: AMZN) and Cherokee (NASDAQ:CHKE) more than once. I summed up my thoughts on the two by saying "At the end of the day, Cherokee pays a 5% annual dividend yield. Amazon does not."
Cherokee recently announced a 50% reduction to their quarterly dividend. So I sold. Specifically, I sold at $14.75 when the markets opened on Wednesday morning in the aftermath of Hurricane Sandy.
I then turned around and bought Riverbed Technology, Inc.(NASDAQ:RVBD). This network technology company has been on my radar. They've managed their money well, they're profitable, and they've recently been growing by acquisition. Their most recent acquisition of OPNET Technologies, Inc.(NASDAQ:OPNT) has caused Riverbed's price to tumble, though. On Wednesday the price of Riverbed was down nearly 20%. So I bought. Specifically, I bought 100 shares at $18.36 each.
The dip in price will be temporary, I'm sure. For now I've put a sell order in for twice my purchase price, but that's just a hedge against a ridiculous over-correction. I'll probably sell for less than that at some point, when I want to do some profit-taking and buy something else.
01 November 2012
01 October 2012
Catching Up October 2012
I posted last week for the first time in roughly six months. I took the occasion to give a quick and dirty Annual Report. During the six months in which I neglected to update ye olde blogge, though, I continued to sell and buy equities within my rollover IRA, but I did not continue to inform my loyal readership of what I sold and what I bought, etc.
Well, that changes as of right now. There were a lot of trades during the Six Months Of Silence. If I had been a more faithful blogger then I would have written a nice little column about each decision I made at roughly the time I made it, with all the pros and cons. I would have let you know why I did what I did when I did it.
Well, it's too late for that now. At this point I barely remember why I did what I did when I did it. And even if I do remember, I definitely do not have the patience to walk you through the thinking behind every investment decision I made for six months.
I can, however, list those decisions in order, with a minimum of commentary. Here we go.
16 April: Sold 100 shares of 3D Systems Corporation (DDD) at $25.78 each. Having purchased my shares at $15.50, I feel good about the profit I realized with this trade. That said, it turns out I could have - in a perfect world - sold the shares in question for $43 each or more in late August.
20 April: Purchased 190 shares of Monster Worldwide, Inc. (MWW) at $8.32 each. I've had a few opportunities, since then, to sell for $9 or more, but I'm hoping, eventually, to sell for $24 or $25 a share. Of course, I'm not sure when exactly that will be. The theory is that the shares will recover whenever the job market does. As of this writing, though, my shares are worth about $7.50 each.
23 April: Purchased 80 shares of Cherokee Inc. (CHKE) at $12.25 each. This stock pays a pretty respectable quarterly dividend of $0.20 per share.
18 June: Sold 17 shares of Amazon.com, Inc. (AMZN) at $220.74 each. I had purchased my shares for $174.25 each, so that was a decent profit. That said, Amazon's price per earnings is a bit high. I think it's over-valued.
21 June: Purchased 70 shares of Dreamworks Animation Skg Inc (DWA) at $17.85 each. I saw it as under-valued, and I figured Madagascar 3 would do okay at the box office.
25 June: Sold 81 shares of Cherokee at $13.49 each. As you can see, I was able to sell more shares than I had originally purchased. How cool is that? I love Dividend Reinvestment.
25 June again: Purchased 15 shares of Amazon at $218.70 each. Amazon may be priced a bit high, but my fellow investors love it. I sold my Cherokee stock in order partially to finance this purchase. Honestly, I can't remember why, specifically, I decided to turn around and buy Amazon again. I think I still had cash from my sale of Amazon a week before, and decided that, all things being equal, it had been doing me more good while invested in Amazon.
13 July: Sold 70 shares of Dreamworks Animation at $19.80 each. I'd made my profit and I got out. I don't foresee Rise of the Guardians doing too well over Thanksgiving. In fact, I saw a cardboard display for Rise of the Guardians in a theater when I finally saw The Avengers and my first thought, upon seeing the Rise of the Guardians display, was "I need to sell my Dreamworks Animation stock."
16 July: Purchased 140 shares of Corning Incorporated (GLW) at $12.24 each. This is an under-valued, dividend-paying stock. The dividend could be bigger, but I'm hoping to sell at over $22 a share, someday. If I can accumulate some extra shares while I'm waiting for Corning to increase in value then that would be a nice bonus.
19 July: Sold 15 shares of Amazon at $223.40 each. I went back to my belief that Amazon is over-valued. Of course, it turns out that if I'd held onto my shares then I could have sold them for $250 or more, each, since then. That said, this sale at this time allowed me to make my next purchases.
23 July: Purchased 100 additional shares of ABB Ltd. (ABB) at $15.69 each. This is a stock I already owned. I'd purchased shares, previously, at $18 each. It pays a decent annual dividend. I'd had an opportunity to sell at nearly $22 a share back in February, before the dividend was paid for the year. Since then my shares had declined in value. This purchase was me doubling down, and I'm glad I did. ABB has gone up by a greater percentage than Amazon during the same period of time.
23 July: Purchased 125 shares of Cherokee at $14.02 each. I didn't want to put all of my eggs in the ABB basket, so I purchased Cherokee again. I could have purchased at a lower price if I was more patient, but I'm not unhappy with how things are.
Amazingly enough, that's it. I've not done any buying or selling since July. Some shares have been purchased for me, during the six months in question, as a result of dividend reinvestment, but I'm mostly eliding those transactions for now.
Apparently I'm a bit indecisive. I bought some Cherokee. I sold my Amazon. I then sold my Cherokee and bought some Amazon again. And then I sold my Amazon and bought Cherokee again.
At the end of the day, Cherokee pays a 5% annual dividend yield. Amazon does not. That said, if Amazon stock takes a temporary dive then I just may get a bit indecisive again.
26 September 2012
Annual Report September 2012
Months ago I stated my intention to update this blog weekly. Every Monday, I assured my readers, I would have a new column about what I'd been doing and / or thinking, investment-wise.
I have failed. Multiple Mondays have gone by without any update from me. My last post, as of this writing, was nearly six months ago.
For a while I wasn't posting because I couldn't seem to find anything about which to write. Things were static. I had made my investments. I received the occasional dividend. That was it.
There was one investment that occupied a certain number of my waking thoughts throughout the month of March, and I wrote at some length about the Cunning Plan I had regarding MIND CTI (MNDO), how I needed to rework said Cunning Plan, and the temporary failure of the Cunning Plan in question. At this point I will revisit that particular Cunning Plan as we approach March 2013, assuming that our collective understanding of the Mayans is wrong and we get all the way through 2012.
That said, I do need to update my loyal readers on what I've bought and sold in the last six months. In addition to this overdue update, I'd also like to present to you all something akin to an annual report.
Yes, an annual report. I first opened the investment IRA account about which I've been blogging on September 16th, 2011. My first actual purchase of stock was on September 19th, 2011. So it's been just over a year. Let's do this.
Quick and dirty version:
On September 16th, 2011, I opened the account with $6,240 from a rollover 401K.
In November 2011, I doubled down. I transferred an additional $6,220 into the IRA, making my total investment $12,460.
As of the September 16th, 2012, my investment was worth $17,877.
(Actually, it was worth $17,956.89, but I figure I would have had to pay $9.99 per trade in order to liquidate my positions in the 8 equities in which I am currently invested, should I have been so lucky as to sell at the closing prices on Friday September 14th. Anyway, those fees for cashing out would reduce my total by $79.92, leaving me with $17,876.97, which is close enough to $17,877 that I feel justified in rounding up by 3 cents.)
That's an increase of over 43%. That's a pretty good yield for the year. Only time will tell if I can keep it up.
I've updated my list of holdings over on the right. In the near future I'll provide a summary of my trades over the past six months. Maybe I'll manage to get back in the habit of writing weekly updates.
We'll see.
02 April 2012
My Cunning Plan Will Take Longer Than I Thought
I could just as easily have
titled this week's post as My Cunning Plan Has Failed, but it hasn't failed
permanently. It's just failed for now
The Plan was to buy MIND CTI
Ltd (hereafter referred to as MNDO) at a low price in September of 2011 and sell my shares in March or April for roughly
twice the purchase price. A simple,
two-part plan.
Part 1 went swimmingly. I bought 1,600 shares of MNDO at $1.85 a
share in September. Yay.
Part 2 never quite
coalesced. The stock didn't peak in
March and didn't double this year to $3.70 a share.
It did, however, peak in February and increase by nearly 50% to $2.76 a
share. Had I sold at that time then my
cunning plan would have been a success.
Not the success that I had hoped, but a significant success nonetheless.
But I wasn't ready to sell in
February. I missed the peak, just
barely. The day it peaked I did reduce
the price of my sell order to $2.78 a share, but the stock never went to $2.78
a share. Not this year anyway.
But there's always next year.
That's what I'm telling myself, anyway. My revised cunning plan is that I don't have
to buy shares in MNDO in September because I already own shares. In fact I now own 1,749 shares in MNDO thanks
to the magic of dividend reinvestment.
MNDO paid its dividend last week, and 149 additional shares were
purchased for me without me spending an extra dime.
My sell order is in. I'll be selling my 1,749 shares for $2.75 a
share. I'll have to renew that sell
order a few times between now and March of 2013, and somewhere in there I may
have reason to increase or decrease the price per share. But if something unexpected happens and the
stock price shoots up sufficiently between now and next year then the sale
should go through automatically at $2.75 a share.
And my cunning plan will
succeed. It will just take longer than I
originally thought.
Meanwhile I will have the
distinct displeasure of staring at another item in my portfolio that is worth
less than I paid for it. As of this
writing my shares in MNDO are worth $1.81 each.
Bugger.
But at least I still have a
cunning plan.
12 March 2012
My Cunning Plan Is On Hold
Last week I wrote that my cunning plan was working. This is no longer, strictly speaking, true.
I had decided to sell my 1,600 shares in MIND CTI Ltd (MNDO) for $2.51 per share. There's only one problem: No one wanted to buy at that price. The highest price the stock has managed to attain since my decision was $2.44.
So I didn't sell. Since then the ex-dividend date and record date for MIND CTI has passed. This means that if someone were to buy the stock today then that buyer would NOT get the healthy annual dividend that one could get if one bought the stock before the 12th of March.
Here's a little something I wrote in the previous column:
If I don't sell by then, though, I'm going to cancel my sell order for 1,600 shares, take the dividend on the pay date of March 28th, automatically invest that dividend in 100+ additional shares, and then put in a new sell order for 1,700+ shares (possibly for as low as $2.36 a share).
That's the plan. And I was feeling pretty good about the plan. Until last Friday when MIND CTI closed at $1.88 a share, after an intra-day low of $1.86. That's not much more than I paid for it.
My plan of selling for $2.36 a share now seems overly optimistic.
I've sat down and done the math. My break-even point is $1.69 a share. If the stock is at that price when my dividend is automatically reinvested then I'll get another 170 shares, giving me a total of 1,770 shares. If I can sell those shares for $1.69 each then I'll make a net profit (after all my trading fees, etc.) of $10.
That's not impressive, but at least I'm not losing money.
The upshot is that my sell order has been cancelled for now. I'm going to get my additional shares and then re-assess. If I can sell my shares in MIND CTI Ltd for $2.36 or more then I'll definitely go ahead and cash out. If the price drops below $1.69 a share then I definitely won't cash out. At that point I'll just hold on to my shares until next year's dividend, probably.
I don't know what I'll do if the price is halfway in-between.
The dividend should be paid no later than the 29th, and I'll end up taking some kind of action - or inaction - no later than the 30th. I'll let you know what ends up happening with my cunning plan.
In the meantime I'll try to find something else about which to write between now and then. Questions and comments are always welcome.
07 March 2012
My Cunning Plan Is Working
Mostly. Kind of.
The plan is this: Do what I did in Fall 2010 and Spring 2011, but moreso.
In the Fall of 2010 I bought 300 shares of MIND CTI (hereafter referred to by its ticker symbol of MNDO) for $1.86 per share. In the Spring of 2011, MNDO rose to $3.57 a share and also paid a dividend of $0.32 per share. I sold and netted a 90% profit, once all was said and done.
In order to do the same thing, but moreso, I just needed to buy more shares this year.
Accordingly, in the Fall of 2011, I bought 1,600 shares of MNDO for $1.85 per share. It’s now Spring of 2012 and MNDO has been generally rising. At one point in the last month it was $2.78 per share.
I probably should have sold then. But I didn’t know then what I know now. To wit:
MNDO recently announced their annual dividend. This year, though, instead of $0.32 per share, the dividend is going to be $0.24 per share. This year’s dividend is 75% of last year’s.
But wait, there's more! MNDO is an Israeli company, and Israeli taxes are taken out of the dividend before that dividend gets near the shareholder. Last year the tax was 20%. This year it's 25%. Oy.
Once the taxes are taken into account, this year's practical dividend is 70.3% of last year's. Instead of rising to $3.57 a share, then, it’s reasonable to assume that MNDO will only rise to about 70% of that amount, AKA $2.51 per share.
And that still rocks, of course. But I’m not going to net a 90% profit. Instead I’ll probably be netting a 35% profit.
I could take some risk with the timing of the dividend payment, dividend re-investment, and the sale of my additional shares as a result of the aforementioned dividend reinvestment and maybe, just maybe, net a 36% profit if it all goes perfectly, but more likely under this scenario I’ll end up reducing my profit when all does not go perfectly.
With all that in mind, then, I’m modifying my sell order for my MNDO shares. I’m planning to sell at $2.51, and I'm willing to sell before the stock goes ex-dividend on Monday March 12th.
If I don't sell by then, though, I'm going to cancel my sell order for 1,600 shares, take the dividend on the pay date of March 28th, automatically invest that dividend in 100+ additional shares, and then put in a new sell order for 1,700+ shares (possibly for as low as $2.36 a share).
I might make more money after taking the dividend, but it's a bit more work, and I have to have my money tied up in this investment a little longer, meaning that I might miss another opportunity.
For instance, RadioShack(RSH) has just announced a reasonably sweet quarterly dividend, but the ex-dividend date is March 14th. If I have to leave my investment in MNDO alone until the end of March then RadioShack's dividend is an opportunity I'll definitely miss.
RadioShack is not the only thing I'm thinking about buying, and I'm not planning to put all of my eggs in one basket, anyway. Let me refine my thinking about the various baskets under consideration and I'll write about them in the near future.
Of course, I’ll not be deciding anything for certain until I sell my shares in MNDO. Without cash in hand all I’m doing is dreaming of the various baskets in which I might invest. When I’m taking action in the waking world, though, then I’ll let you know what those actions are.
As of now, though, I've reduced my sell order for MNDO to $2.51 a share.
04 March 2012
Further Ruminations on Book Values
I want to follow up on a column I wrote a couple of weeks ago in which I stated that a stock priced below its book value is most likely under-valued. The implication of that statement is that such a stock is a great buy, and therefore I or you or someone should snap up such a great bargain while it's possible to do so.
In the column in question I also implied that a potential investor should ask what is wrong with a stock priced below book, so technically I covered the need to be cautious, but upon further consideration I wish to make a couple of clear, concise statements:
The reason for this sudden outburst of clarity is that I have, in the past, bought stocks because they were under-valued, and it didn't work out terribly well for me. I don't want to give my readers the idea that this is an investment strategy that I still actively follow.
At least, I don't think I do. For my most recent investments I don't know, off the top of my head, what the price per book was for each of them at the time of purchase.
But this is the age of the inter-tubes, and with a little research I've come up with the following:

In the column in question I also implied that a potential investor should ask what is wrong with a stock priced below book, so technically I covered the need to be cautious, but upon further consideration I wish to make a couple of clear, concise statements:
- Don't buy a stock just because it's cheap.
- Don't buy a stock just because it's priced below book.
The reason for this sudden outburst of clarity is that I have, in the past, bought stocks because they were under-valued, and it didn't work out terribly well for me. I don't want to give my readers the idea that this is an investment strategy that I still actively follow.
At least, I don't think I do. For my most recent investments I don't know, off the top of my head, what the price per book was for each of them at the time of purchase.
But this is the age of the inter-tubes, and with a little research I've come up with the following:

The Book Value in the chart above is the book value per share as of the most recent quarterly report before the day I purchased my shares. In some cases the book value has changed since that time.
Most notably, the book value for Sigma Designs (SIGM) is significantly lower, now, than it was when I bought it. For that matter, so is the price per share. As of this writing the book value is $8.13 per share, but the price is $5.52 per share. The upshot is that the price per book is about the same now as it was then.
Basically, the most "under-valued" stock that I purchased has been the biggest loser for me. The only loser, actually. All the rest of the stocks in the chart above have performed quite well. The "bargain" stock hasn't.
Upon reflection, the least I can do is try to warn my loyal readers - both of them - away from a course of action to which I may have inadvertently led them. Hence the clarification.
Caveat emptor, and let's be careful out there.
29 February 2012
Missed it by THAT much
I think I missed an opportunity to sell a stock and make a profit.
Last week 3D Systems (DDD) shot up in price, briefly, to $25.77. I tried to sell. I did some math and lowered the price of the sell order I already had in place. I brought my asking price per share down to $25.78, which would net me a 65% profit on the buying and selling of that particular stock, but it appears I should have gone lower. 3D Systems didn't reach $25.78, and it has been declining in price since then. As of this writing it's less than $22.50 a share. Looks like I missed an opportunity window.
I've bought, sold, and bought stock again in 3D Systems. I've mentioned it in previous columns. Let me recap in a different way, though, for the visual folks out there.


I'm not kicking myself too hard, though. I tell myself that if 3D Systems went over $25 recently then it probably will again, someday, and then I'll sell, take my profits, and reinvest them when I get the chance.
The worst case scenario, moving forward, is that the price goes back down to $15 or $16 before coming back up over $25. That would be a little difficult, emotionally, but if my IRA makes a nice profit at the end then I'll find a way to cope.
It's just as likely, though, that the recent upward price trend for 3D Systems will continue. And if that happens then maybe $25.78 is too low an asking price. Maybe I should put my asking price back to $31.20. At that price I would make a 100% net profit, which seems like a nice goal to have.
Or maybe I should leave it at $25.78 and let it ride.
For now I seem to be letting it ride. This has been my disclosure update, then. It's official. I hope to sell my 3D Systems stock in the near future, for $25.78. I'll let you know if that changes.
Last week 3D Systems (DDD) shot up in price, briefly, to $25.77. I tried to sell. I did some math and lowered the price of the sell order I already had in place. I brought my asking price per share down to $25.78, which would net me a 65% profit on the buying and selling of that particular stock, but it appears I should have gone lower. 3D Systems didn't reach $25.78, and it has been declining in price since then. As of this writing it's less than $22.50 a share. Looks like I missed an opportunity window.
I've bought, sold, and bought stock again in 3D Systems. I've mentioned it in previous columns. Let me recap in a different way, though, for the visual folks out there.


The worst case scenario, moving forward, is that the price goes back down to $15 or $16 before coming back up over $25. That would be a little difficult, emotionally, but if my IRA makes a nice profit at the end then I'll find a way to cope.
It's just as likely, though, that the recent upward price trend for 3D Systems will continue. And if that happens then maybe $25.78 is too low an asking price. Maybe I should put my asking price back to $31.20. At that price I would make a 100% net profit, which seems like a nice goal to have.
Or maybe I should leave it at $25.78 and let it ride.
For now I seem to be letting it ride. This has been my disclosure update, then. It's official. I hope to sell my 3D Systems stock in the near future, for $25.78. I'll let you know if that changes.
20 February 2012
Waiting
I hate waiting.
If I know I'm going to be waiting for something or someone then I try to make sure I have a paperback, although these days I really make sure I have my iPod Touch. If I'm somewhere with WiFi then I can surf the latest news, and if I'm somewhere without WiFi then I can listen to one of the many audio programs I have saved, or even read a little bit of classic (and therefore free) literature on my Kindle app.
Waiting for one of my stocks to go up in value to the point at which I am ready to sell it, though, isn't like waiting in a waiting room or waiting to meet my wife at a restaurant or waiting for a bus. It's like waiting at a dance for someone to ask onto the floor. It's an alert, vigilant, opportunistic waiting. It's watching and waiting. It's waiting to spring into action, should action be appropriate.
I wonder if it's like hunting? Maybe it is. I'm tempted to run with a Hunting metaphor for a while. The rush of Success and its attendant Bounty. The gut-wrenching Emptiness of Failure and the attendant knowledge that one's future is Uncertain . . . . That's if one is hunting for one's food, of course.
Maybe it's like fishing. Or maybe it's like a stakeout. Any of these metaphors would be more useful to me if I was a hunter, or a fisherman, or a detective . . . .
The point is: I hate this vigilant waiting, but it's what I'm doing right now.
While I'm waiting, I'm researching. I'm looking for undervalued stocks that I'm certain will be better valued in the future. Two weeks ago, just beginning to wait, I cast my gaze upon Research In Motion (hereafter often referred to by its ticker-symbol of RIMM) and it became the subject of that week's column. At the time I intended to write about my decision-making process regarding RIMM in even more depth, but my self-imposed deadline arrived and I'd already written everything that really mattered. I contented myself with the promise that I would write more about RIMM, soon.
Soon is now, and now I want to draw my readers' attention to the Book Value of RIMM.
Here's a screen-grab from Yahoo's Key Statistics page for RIMM. I've circled in RED the item I want to draw your attention to: The Price per Book.

The Price per Book is literally the price of a share of the stock divided by the book value of a share of stock. If you go directly to the Key Statistics page you can see that the book value of a share of RIMM is $19.77. It's near the bottom of the page, so I can't do a screen-grab that shows the book value and also still says Research In Motion, but that's okay, the Price per Book is what I want to expound upon, anyway.
Still, before we get into some simple math, it's important that we understand the book value per share. It's like the Blue Book value of a car. Someone somewhere (either an analyst at a company called Capital IQ, or an analyst in the finance department of RIMM, or both) has done some calculations on all the assets of RIMM and come up with a dollar-amount of what it's worth - the book value. Divide the book value by the number of shares outstanding in the stock and you get the book value per share.
Okay, so how does Yahoo's Key Statistics page calculate the Price per Book?
The price of the stock, in nice bold numbers at the top of the screen-grab, is $15.07. Grab your calculator and divide $15.07 by 19.77 and you get . . . something that is not quite 0.78. I'm coming up with 0.762. What is up with that?
Here's what's up: Yahoo's Key Statistics page is not burdened with the task of updating the Price per Book every second of every trading day as the price changes. Instead it takes the price as of the beginning of the most recent trading day and uses that in its calculations. This means that even though I'm writing this on President's Day and the markets have been closed for three bloody days, Yahoo is using RIMM's opening price of $15.39 on Friday the 17th in order to calculate the Price per Book.
Divide $15.39 by 19.77 and you get 0.778. That's more like it.
The point, though, is that as of this writing the Price of a share of RIMM is less than the Book value of a share of RIMM, meaning the Price per Book is less than 1.
Why do I care? Because there's not a much better indicator out there that a stock is under-valued then the fact that it's trading for less than it's book value, and I'm looking for under-valued stocks. It's like looking for houses that are selling for less than they were appraised for - not too difficult to find just now. Or maybe it's like looking for cars that are priced under their Blue Book value.
Of course, if a car is priced significantly under its Blue Book value then the first thing a potential buyer should ask is "What's wrong with it?"
In a previous column I covered what's wrong with it. The company's market share has tanked, and until the Blackberry becomes a serious competitor in the SmartPhone market then it's not going to get any better.
That said, the Blackberry does have its niche in the communications ecosystem. It may never grow beyond its niche, but if it does at least hold onto the niche it has then the price of Research In Motion stock should come back up to book value one of these days. It's not like RIMM isn't making money. Look at the Key Statistics page again. RIMM makes billions of dollars in Net Income each year, and is currently debt-free.
It looks like a great buy. I want to know more. Specifically, I want to know how the book value has been fluctuating over time. Has the book value been declining along with the price?
Fortunately, there's a site that can tell us what the book value of RIMM has been over time: ycharts.com. It's a site that I find occasionally handy. It offers all kinds of convenient graphs of historical data for a given stock. Some if it, like Operating Margin, you have to be a paying subscriber to ycharts in order to view. Some of it - like book value - you can look at for free. Have a look at this:

This is a graph of Research in Motion's book value per share over the last 10 years. I'm not sure why ycharts doesn't have data for May of 2008, but because it doesn't there's a gap for a couple of quarters.
We can see from this graph, though, that RIMM has been consistently growing in book value per share. This speaks well of the company's management team, or former management team, anyway. The management at RIMM has recently gone through a major shake-up. Of course, it seems that investors weren't thrilled with the old management. Investors are evidently more concerned about the price than about the value.
It's possible that the new CEO is just what Research In Motion needs, but for now he's unproven in that role. He'd been COO for some time, though, prior to becoming CEO.
For now, the upshot is that nothing has changed for me. I'm still vigilantly watching the stocks I own to see when I'm ready to sell, and I'm still looking for stocks that I'm convinced I want to buy. I'm not convinced that Research In Motion is a great buy, but I'm also not convinced that it's not. I'll be watching it. And I'll be waiting.
UPDATE: After some consideration I have clarified my thoughts on under-valued stocks. Please see this more recent post for further ruminations on price per book.
14 February 2012
Skip Week
I think I'm giving this week a miss. I want to write about Profit Taking and High Frequency Trading and how I think it's basically evil and distorts the markets and leads to disasters like the Flash Crash, but I can't seem to bring together my thoughts in any coherent way.
For that matter, I have to admit that I'm as guilty as anyone of buying stocks that I don't plan to hold onto for years and years. I do my own profit taking with some frequency, I suppose, just not crazy-fast computer-driven only-own-it-for-a-few-seconds frequency. I engage in Low Frequency Trading.
It comes down to the fact that I'm pursuing a mix of strategies. Some stocks I'll hold for a very few months and sell, not when I think it's an especially good time to take some profits out of that particular position, but because something else I want to buy comes to my attention. I love a bargain. When I see a new bargain then I'm apt to sell a stock that was once a bargain but has become clearly profitable while I sat on it.
That said, I do have one stock that I plan to sell in the next couple months and I don't know, as of this writing, what stock or stocks I will buy with the proceeds.
I've written before about how I try to take advantage of MIND CTI (MNDO) and its annual dividend to make a nice, annual profit for myself. It's not exactly the buy and hold strategy that I'm enacting with the few shares of Amazon (AMZN) that I've purchased.
My point, though, is that I know (or I think I know) that I'm going to be selling my shares in MIND CTI in March or April, and that this is a clear exercise in profit taking, albeit infrequent profit taking, so I'm having trouble writing about what exactly my moral position is in all this.
Because it seems to me that the stock market ought to be all about investors enacting ye olde buye and holde strategy. But that's not really what I do, usually. No, for me it's more like Flip This Stock. Buy it. Let it appreciate. Sell it.
Sometimes the Let It Appreciate step is just a couple months. Sometimes it's six months. Sometimes it's years.
The conclusion I seem to be arriving at is that one is not necessarily better than another. Different hold times are appropriate for different stocks, and for different investors. But that means I don't get to complain about the strategies of other investors and institutions.
So. Nothing insightful here this week. Sorry.
I am going to be spending some time trying to figure out what to buy next, though. Last week's rambling about Research In Motion (RIMM) was symptomatic of this. I may ramble about that particular possibility some more in the future. More likely I'll explore some other possible investments with you.
Because I know I'll be buying something in the next couple of months. I just don't yet know what it will be.
06 February 2012
Fun with Google Finance Portfolios
I use Google Finance to keep track of both my actual investments and my potential investments. This has resulted in the creation of a great many Google Finance portfolios. As of this writing I have 15. One of these portfolios consists of the stocks listed on the right-hand side of this blog. Here’s a screen-grab from that portfolio:
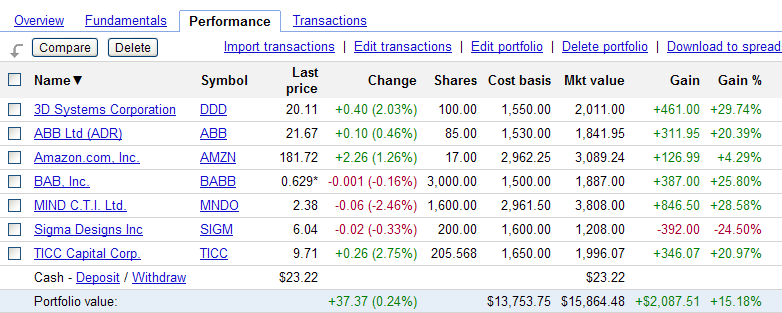
I have listed the companies in my portfolio in alphabetical order by name before doing the screen-grab, as shown by the down-arrow by the Name heading. Portfolio contents can also be listed by symbol, by last price, etc. There are different reasons for listing the contents of a portfolio in different ways.
The screen-grab is of the Performance view. That’s the only view I ever use on my Google Finance portfolios. There are probably excellent reasons why I should be looking at some of the other views from time to time, but I find that the Performance view meets my needs.
Whenever I add a new stock to a Google Finance portfolio I am given the option of entering transaction data, i.e., the number of shares and the price per share. The Performance view then calculates the cost basis for each investment, the market value of each, and the amount and percentage gained or lost on each investment. Gains are in GREEN. Losses are in RED.
You can see, for instance, that I own 200 shares of Sigma Designs (SIGM). The cost basis is $1,600.00. That comes from the fact that I paid $8 per share (200 x $8 = $1,600). At the time that I took this screen-grab, shares of Sigma Designs were $6.04 each. Google has conveniently calculated the amount and percentage lost on that particular investment.
I use a few other Google Finance portfolios to track my various investments. Another portfolio, for instance, consists of several ETFs in which I’m invested through a rollover IRA. Yet another consists of four funds in which I regularly invest through my employer’s 401K program. You get the idea.
The majority of my Google Finance portfolios, though, consist of stocks that I do not currently own, but that I’m keeping under some kind of consideration. I have portfolios named Previous Profit and Previous Loss, for instance, in which I track stocks that I have sold and the price at which I sold them. This is all shear morbid curiosity. These portfolios allow me to see, at a glance, how much my investments in those stocks would be worth if I had NOT sold. I don’t actually look at those portfolios much, though, which is probably for the best.
I look at some of my consideration portfolios a great deal, though. Recently I’ve created two new Google Finance portfolios that I’ve named Cashful Buy and Cashful Sell, and I give those a substantial number of page-views. Here’s a screenshot from Cashful Buy:

Cashful Buy is used to track companies that are both full of cash (that is, they have more cash than debt according to their most recent quarterly reports) and have positive net incomes. They have money, and they’re making more of it. I like that in a company. I don’t actually own any stock in these companies as of this writing, though, so instead of listing multiple shares of each company, I list only 1 share of each, with a cost basis that is essentially an educated fantasy of mine. Google, then, will conveniently list my fantasy price per share as the cost basis for that investment. I won’t have to do the math, then, to try to figure out the price per share at which I wanted to buy when I added it to the portfolio. It’s right there on the page, with convenient gain or loss information as well.
Here’s a screen-grab from Cashful Sell:

Cashful Sell is used to track THE EXACT SAME companies that are in Cashful Buy, however instead of listing fantasy purchase prices for the stocks in question, I have listed fantasy sale prices.
In both cases the prices are meant to be attainable. Likely, even. Possible, at least.
For both screen-grabs, I listed the companies in descending order by percentage gain. For both screen-grabs this left Research In Motion (RIMM) listed at the top of each portfolio. Let us then discuss Research In Motion, the purveyor of the Blackberry mobile device. Here’s yet another screen-grab:

The graph illustrates the fact that it has not been RIMM’s best year ever. The Blackberry used to be the must-have device for the professional on the go. Now the preferred device is an iPhone or perhaps some kind of Android phone. These devices aren’t as secure, perhaps, as the Blackberry, but lately that does not seem to be an issue for most consumers. As a result, RIMM marketshare has waned. The stock has dropped significantly from its 52-week high of $70.54. For the last 3 months RIMM hasn’t been above $20 a share.
If you scroll up and look at the Cashful Buy screen-grab again, you’ll notice that $20 is my fantasy price for RIMM, but since RIMM is, as of this writing, at $17.21 then that fantasy pales in comparison to reality. This is reflected in the Cashful Buy screen-grab. RIMM is the only stock listed in that portfolio that reflects a negative gain.
It’s very useful to be able to tell, at a glance, which stocks, of a group of stocks one is considering, are currently priced below the point at which one might consider purchasing.
If I had any reason to believe that RIMM would regain its marketshare in the near future (or, indeed, ever) then I would be very justified in snapping up some shares. I don't, though. I have some reason to believe that RIMM might recover, but I have no reason to believe that it will.
From what I’ve read, RIMM is biding its time, waiting for a serious mobile-device-security-concern that will drive consumers back to the Blackberry. I suppose such a thing could happen. I’m not sure that it will happen soon, though (or, indeed, at all) and so I have no plan to purchase any shares in RIMM at this time.
From what I’ve read, RIMM is biding its time, waiting for a serious mobile-device-security-concern that will drive consumers back to the Blackberry. I suppose such a thing could happen. I’m not sure that it will happen soon, though (or, indeed, at all) and so I have no plan to purchase any shares in RIMM at this time.
Looking at my Cashful Sell portfolio, then, I can see at a glance that RIMM's current price is 71% below my fantasy sell price, and that this is a greater percentage below the sell price than any other Cashful stock under consideration. Another way of putting this, then, is that RIMM has the greatest potential gain of all of the stocks in that portfolio.
Potential gain isn't guaranteed gain, though, which is why I still have no intention of buying shares of RIMM. Buying RIMM now would be a gamble. A gamble that might, conceivably pay off very well, but also one in which the gambler runs a significant risk of losing all of his bet. The only reason I'm discussing RIMM at such length is because it happens to hold such an interesting position in both of my Cashful portfolios. The potential profit is fascinating, and warrants further attention and study.
We'll discuss methods of further study next week, and we'll continue to use RIMM as our object lesson, unless something much more interesting comes up in the next week or so.
We'll discuss methods of further study next week, and we'll continue to use RIMM as our object lesson, unless something much more interesting comes up in the next week or so.
01 February 2012
Disclosure Update
Mission accomplished. I sold my Netflix stock at a 50% profit, including fees, and then turned around and bought as many shares of Amazon as I could. Specifically, I purchased 17 shares of Amazon at $174.25 each.
The list of stocks on the right-hand side of the page has been updated accordingly.
The list of stocks on the right-hand side of the page has been updated accordingly.
31 January 2012
Disclosure
Well, I just decided to do some selling and buying, so in the interest of full disclosure I'm posting about it immediately. This will be a supplemental entry to the regular weekly blog.
I've put in a sell order for Netflix (NFLX) at $121.44. That particular dollar-amount makes me a 50% profit on the buy and sell trades for Netflix, including the trading fees.
The reason for the sudden sell is NOT that I don't believe in Netflix. The reason is that I believe in Amazon (AMZN) MORE, and there's an opportunity to buy Amazon. In after-hours trading today Amazon dropped about 7% or more as a result of the company's quarterly report. That brings the stock price down to the range in which I want to buy it. I can only afford to buy 17 shares, and I prefer round numbers, so I'll probably buy 15 shares at something less than $180 per share.
I will only be able to do this if my Netflix shares sell, of course. Netflix was a bit weird today, and may not get up to my sell price tomorrow.
None of my orders will go into effect in any meaningful way until Wednesday morning at 9:30AM Eastern, so this disclosure comes about 17 hours before my trades might begin to happen.
I guess tomorrow will be an interesting day for me. I'll let you know how it turns out, when I know.
30 January 2012
Amazon
Some weeks ago I described the characteristics I look for in a stock's financials. The short version is that I look for positive net income and more cash than debt, but here's a link to the original column in case you want the long version.
I also have written about my love of stocks that pay dividends, but this is not a dealbreaker. A stock that doesn't pay dividends can still be an excellent investment, if the timing is right.
Thus far, all of these writings have been framed within an overall narrative in which I have detailed what I currently own and why. I've even discussed, for a few stocks, the price at which I made a purchase and the price at which I am willing to make a sale.
This week I'm discussing the first of many stocks that I don't own, but I am considering for future purchase: Amazon (AMZN). Amazon is very nearly my dream stock. The company consistently produces a very healthy net income, and has literally billions of dollars in cash while also having exactly no debt. It's the industry leader in internet shopping, and is expanding into areas in which it's competing quite healthily with Netflix and Apple. The only thing that Amazon could do further to entice me into buying stock would be to pay a dividend. That said, I'll probably buy some shares whether the company pays a dividend or not.
What's the price at which I'm willing to buy? I'm a firm believer in The Third Rule of Acquisition and so the first question I ask myself is, "What is the smallest price I could possibly be expected to pay for a share of Amazon stock?" It's a simple question, but there's not a simple way to arrive at an answer. Or, at least, there's not a single, simple way that I consistently use. There are a number of competing simple ways that I use in conjunction with each other.
I'll start with a summary page for Amazon. Any summary page will do. Here's a screen-grab from the Google Finance summary page for the AMZN ticker, with the graph conveniently set to 5 years.

Any stock summary page will do because any stock summary page will list the 52-week range for that stock. In this image I can see that, as of this writing, the 52-week range for Amazon was from a low of $160.59 to a high of $246.71.
Also, as I look at the graph, I can see that Amazon's 52-week high of $246.71 is also its 5-year high. In fact, $246.71 is Amazon's lifetime high, but I have had to go find Amazon's lifetime graph to verify that this is the case.
All of this is just to get me thinking about the stock. I've not yet arrived at the price at which I want to purchase some Amazon stock, but I have arrived at a somewhat conservative price at which I would like to sell: $246.71.
This is not my pipe-dream I-can-retire-now price. It's a conservative the-stock-has-recently-seen-this-price-and-so-it-will-probably-see-it-again-in-the-near-future price. In fact, it's probably too conservative, so I'm going to set my completely-theoretical sell price at a nice, round $250.
See, when I look at that 5-year graph for Amazon's stock, I see a little slump back in 2008. That little slump is what the rest of the world calls The Beginning Of The Financial Crisis.
Here's a Yahoo Finance graph of Amazon for the same five years, except it also includes comparison graphs for the Nasdaq, S&P500, and Dow Jones indices. Yahoo chooses to use a graph with an inconsistent vertical scale, which I normally abhor, but in this case it actually allows me to better interpret the comparisons. The same comparisons on Google's consistently-scaled 5-yr Amazon graph are rendered as a very-nearly a flat line at the bottom that really doesn't tell me much.

What I'm trying to say, in words and images, is that Amazon has consistently done well over time, even and especially accounting for The Financial Crisis and The New Normal. Looking at these graphs, I'm tempted to assume that Amazon's stock price will continue in its trend of rising steadily upward for the foreseeable future. That makes its lifetime high of nearly $250 an especially conservative price at which to sell.
Before I get too optimistic about Amazon stock, though, I'm going to look a little more closely at the recent fluctuations in price. In this case, a 6-month graph tells me what I want to know.

The stock has been in a relative slump during the last four months, especially, but it seems to be coming out of it now. The nadir of that slump was at the price of $173.10. That's a bit higher than Amazon's 52-week low of $160.59.
Incidentally, the stock has probably been slumping because investors know that Amazon is selling the Kindle Fire at a loss of $10 per unit. Amazon sold 4-5 million units during the holiday season, so that's a loss of up to $50,000,000.00. That's serious money.
It looks like the informed speculation that the Kindle Fire was probably being sold at a loss appears to have hit in late September of 2011. The same news appears to have been confirmed in mid-November. That explains a lot of what I'm seeing in the 6-month graph. It looks like some investors think that selling the Kindle Fire at a loss might not be the best idea ever.
Of course, other investors disagree, which is why the stock hasn't completely plummeted. One investor's time to get out may be another investor's time to get in.
Personally, I'm bullish on Amazon, but not so bullish that I want to buy this very second. I want to get the stock at the lowest price I can. Having seen a minor freakout on the part of investors in the past few months, it seems reasonable to set my purchase price at $175.
If I can buy at $175 and then sell at $250 then that's a healthy 42% profit. Right now the stock is at $195, though. If I buy at $195 and then sell at $250 then that's only a 28% profit. Of course, 28% is still pretty awesome.
This whole discussion is moot just now, though, because I have no liquid capital to invest in Amazon. Also, I expect to make more than 28% on my current investments, so there seems to be no need to liquidate them just now.
Of course, my Netflix stock has been doing surprisingly well. I was beginning to doubt that investment, in fact, but for now I think I'll let it ride.
That said, if Amazon were suddenly to fall back down to $175 then I'd do some quick math on how much more profit I think I could optimistically wring out of Netflix versus the 42% I think I could conservatively get from Amazon. In that circumstance, I'm guessing Amazon would come out on top.
What if I'm wrong to be bullish? What if selling the Kindle Fire at a loss is the first step to financial ruin for Amazon? More likely, what if the ongoing financial crises in Europe affect markets in such a way as to depress prices on nearly all stocks, Amazon included?
I currently track Amazon and a couple of other companies - Google and Apple - that I'd like to buy in the event of another serious financial downturn. When the financial crisis hit in 2008, Amazon fell from what had been its lifetime high of nearly $100 a share to below $40 a share, briefly. That's an easily-calculated 60% drop.
If so, then it stands to reason that another crisis could drive the price of Amazon down 60% from its high $246.71. That would price the stock at under $100 a share.
If that ever happens, I'm buying. At the very second it crosses $100, in fact. I'll liquidate something to do it. I'll find a way.
I remember when Amazon went down to $40 in 2008. I remember thinking that it looked like a good time to buy, but amidst the ongoing market plunge I thought maybe it hadn't hit bottom yet.
But then Amazon started rising while the rest of the market kept falling. I kept watching Amazon, waiting for it to drop down to $40 again. I had resolved to buy at $40. Or $45. Or maybe $50. Everything else continued to tank. Surely Amazon would drop down to $50 again long enough for me to buy a few shares?
Not so much. It turns out Amazon is a company from which people will buy during a downturn, seeing as how Amazon discounts their merchandise so heavily.
As a result, Amazon not only survived the downturn, but thrived within it. Now Amazon is in the business of putting everyone else out of business.
So yes, I'm going to buy some Amazon stock someday, when the timing is right. If Amazon ever falls to $175 then I'll probably buy then, and if there's some kind of crisis and it falls to $100 then I'll hold onto whatever shares I bought on its way down and then buy more if I possibly can.
Because, ultimately, I think that $250 is way too conservative a price at which to sell Amazon stock.
23 January 2012
Timing
It's all about timing. Knowing when to buy. Knowing when to sell. It's all timing. Well, occasionally it's timing and luck.
It was luck more than timing for me in October. I needed to sell something because I had decided to buy some stock in Netflix (NFLX). I looked over my portfolio and decided that my 100 shares of 3D Systems (DDD) stock had already made me a tidy profit. I had purchased my shares at $16 and they had gone up to $19. Mind you, I think 3D Systems will go to $25 someday, based on past performance, but past performance is no guarantee of future performance and all that jazz. More importantly I needed some cash if I wanted to buy Netflix.
Also, even if 3D Systems did go to $25 then that was an additional profit of 32% or so. However Netflix in late October was priced around $75, and I thought it could go to $180. That would be a profit of 140%, and a potential profit of 140% beats a potential profit of 32% all to pieces.
I decided to take the win. I sold my 3D Systems stock at $19 per share on the 26th of October. I bought 24 shares of Netflix at $80.14. I wanted to buy 25 shares at $75, but it was already on its way back up, so I decided to do 24 shares at the higher price, instead.
It turns out I could have waited. We'll get to that in a second. First let me tell what happened to 3D Systems' stock. It fell. On the 28th of October, just a couple days after I sold, it suddenly fell, closing at $16.20. Over time it fell even more for a while. I had gotten out just in time. I can't tell you why it fell. Press releases, internet chatter, and company reports look just as good before the fall as after. It may have simply been the market being weird. I don't know. Sometimes good timing is just luck.
Good timing is also paying attention, though. I kept watching the 3D Systems stock. I watched it fall and eventually I bought again. I still believe in 3D Systems, and I know a bargain when I see one. I bought 100 shares again, this time at $15.50. As of this writing it is flirting with a price of $19 again, so I'm likely to profit from that trade a second time. That said, I have no plans to sell it just now, unless I see something else I really want to buy, at a price I want to pay for it.
My point is this: Timing is everything, even if it's just lucky timing.
My timing was adequately lucky with Netflix. As stated above, I purchased 24 shares at $80.14. Immediately afterward the stock continued its climb, and I felt ever-so clever. It got up into the $92 range within a week of my purchase. Had I sold at $92 then that would have been a nice 15% profit for a week's worth of investment.
I didn't sell, though. My theory on Netflix was that it would climb to $180 or so. So I held on to it.
And then it began to fall again. And fall. And fall. Four weeks after my purchase it closed under $64. Had I waited, I could have bought 30 shares at $64 each.
Here's the thing, though: When a stock is falling, you have no idea where it's going to hit bottom. With the benefit of hindsight I can now say that I should have waited and bought 30 shares at $64, or even that I should have sold at $92 and then turned around and bought more than 30 shares at $64, but that's looking back from now. From then, as it fell and fell and fell down past $64, I was mostly just kicking myself for being in such a hurry to buy at $80. I didn't once think about commiting more money and buying more shares at $64. I didn't know when it was going to hit bottom. It was entirely possible that it would keep going below $64 just like it had passed $80, and $75, and $70 on its way down. No sir, there was no way I was buying until it was on its way back up.
Hindsight is a wonderful thing, but unless you've got a time machine it's pretty much useless.
Well, Netflix is on its way back up. In fact, Netflix has been hanging out above that $92 mark again. Maybe now I should sell. Or maybe now I should hold on to it. I do think it will go up, maybe even to $180, still. That said, I don't think I want to buy more right now. If it goes below $75 again then maybe I'll sell my 3D Systems stock in order to buy some more Netflix. Maybe not. It all depends on what is at what price when.
My point, still, is that it's all about timing. It's all about buying low and selling high. Nowhere in this column have I discussed Netflix's fundamentals, or what caused all of its massive fluctuations. The fact is the market is going to fluctuate, and individual stocks are what make it fluctuate. The best we can do, as individual investors, is try to figure out the range in which a stock will fluctuate, and then take advantage of its movements within that range. Maybe I'm wrong about the upper end of Netflix's new range, and it will fluctuate between $64 and $100 for a while. If so, I can still make some money off of that. The only thing I don't know for sure is when it will be up and when it will be down.
This brings me back around to a stock I mentioned at the end of my previous column: MIND CTI Ltd (MNDO). This stock pays a nice dividend, and pays it annually. This last fact - the annual payment of dividend - lets us know that investors will be buying the stock (driving the price up in the process) as that annual dividend date approaches. We know, that is, when it will be up. Or, at least, when it will probably be up.
This is a good time to introduce my loyal reader(s?) to Dividend.com. Dividend.com is a website that tracks dividend-paying stocks and gives investors like us a few vital pieces of information. For MIND CTI, for instance, Dividend.com shows us that the dividend last year was $0.32 per share, that the dividend was declared on 2/16/2011, that the ex-dividend date was 2/24/2011, that the record date was 2/28/2011, and that the pay date was 3/21/2011.
What's with all the dates? I really should have gone over all this in my post on the subject of dividends last week. Oh well, we're here now. Let's break it down.
The declare date is pretty straightforward. On February 16th the company announced all the rest of the information. They declared what the dividend per share would be, when it would be paid, and to who.
Obviously the pay date is when the dividend is paid. The other dates are what determines who gets paid.
The ex-dividend date is the last date an investor can buy the stock and get paid the dividend.
The record date is the date an investor has to be holding the stock in order to get paid the dividend.
So. In order to collect last year's dividend, an investor in MIND CTI needed to buy the stock no later than 2/24/2011 and hold onto the stock through 2/28/2011. If an investor sold the stock on March 1st then they'd still get paid the dividend, but if an investor sold the stock on Friday the 25th of February, 2011 then that investor would get no dividend.
This last I don't completely understand. For instance, if someone sold the stock on Friday the 25th then who does get the dividend? Does anyone? Whoever owned the stock when the markets closed on 2/24 gets the dividend, unless he sells the stock on the 25th, in which case that seller doesn't get it, but neither does the buyer, because the buyer didn't own the stock on the 24th. So does the company just keep the money? I have no idea.
The only reason I bring up all these confusing dates is this: It might be interesting to see what happened to MIND CTI stock between and around all of these dates. Let's have a look at the Google Finance graph for MIND CTI for the last year and a half or so.

It looks kind of like a bell curve. In late 2010 the price was very low - under $2.00 - but then at the end of October 2010 it suddenly shoots up to almost $2.50, and then generally trends upward until the mid-February. Between February 11th and 18th it has another very steep spike upward, closing over $3.40 on the 18th, just after the declare date, but before the ex-dividend date.
That's all pretty straightforward. It makes sense that investors would let the stock languish for most of the year, then start buying as the dividend gets closer and closer. It also makes sense that the stock would fall after the record date. During March the stock dipped below $3.00, briefly.
What's kind of weird is the way the stock leaps back up after the dividend is paid. You'd think it would fall immediately, but instead it rises for a while before it begins its yearly fall. I think this second rise is explained by dividend reinvestment.
I own MIND CTI now, but it's the second time I've owned it. I originally bought 300 shares in October 2010 for $1.86 each, for a total investment of $558.00. I held onto my shares through the declare date, the ex-dividend date, and even the pay date of 3/21/2011. Then, on 3/22/2011 there was an automatic flurry of activity in my TDAmeritrade account.
First, I received my dividend of $0.32 per share, which came out to $96.00.
MIND CTI is a foreign stock, though. It's an Israeli software company, and the Israeli government took a hefty 20% chunk of my dividend away. Fine. That also happened automatically, leaving me with a net dividend of $76.80. Still not bad at all.
But wait! There's more! I have dividend reinvestment in place on my TDAmeritrade accounts. This caused my net dividend of $76.80 to be spent on 24.774 shares of MIND CTI at that day's price of $3.10, with no additional fee. The upshot is that my investment of $558.00 back in October of 2010 left me (after all things dividend) with roughly 325 shares of MIND CTI. I then sold all of those shares in early April of 2011 at $3.36 per share for a total of $1,081.20. After I subtract my initial investment and my TDAmeritrade fees for my initial purchase and my final sale then I ended up with a net profit of $503.22, which is a 90% profit.
Sweet!
If my timing had been slightly better then I could have sold those 325 shares for $3.49 each, or maybe even $3.55 each. Still, my timing was pretty good. I'm not going to complain.
In fact, I'm so happy with how that all turned out that I'm trying to do it again, but bigger. In September of 2011 I bought 1,600 shares of MIND CTI at $1.85 each. I hope to sell these shares, plus any others I get from dividend reinvestment, for at least $3.50 each sometime in the next 3 months, if my timing is right. It's all about timing, and luck, and dividends in this case.
The fact is, this could also go horribly wrong. MIND CTI could announce that they're not paying a dividend this year, or that they're paying a much smaller dividend than last year. If that happens then the stock price, which has climbed up to $2.20, could nosedive to $1.75 or below.
If it does, maybe I'll buy more of it. That's a good price, assuming it pays a good dividend someday. We'll see.
Anyway, this same phenomenon - price fluctuation around dividend dates - can be applied to any dividend-paying stock, however it seems to work most profitably in a case like this one where the dividend is paid annually. Stocks that pay their dividends quarterly don't seem to fluctuate nearly as much. My best guess is that the window between a quarterly pay date and the next declare date is just too narrow to allow a stock to cut its price and half and then come back.
There are also many, many stocks that pay no dividend. They're still going to fluctuate a bit around annual reports and quarterly reports and opinions and news items. Needless to say, none of these things has quite the anchoring effect that a regular dividend does.
That said, next week I'll try to identify a fluctuation range for a stock that pays no dividend and, so far, doesn't seem to have a ceiling price: Amazon (AMZN).
Subscribe to:
Comments (Atom)