I use Google Finance to keep track of both my actual investments and my potential investments. This has resulted in the creation of a great many Google Finance portfolios. As of this writing I have 15. One of these portfolios consists of the stocks listed on the right-hand side of this blog. Here’s a screen-grab from that portfolio:
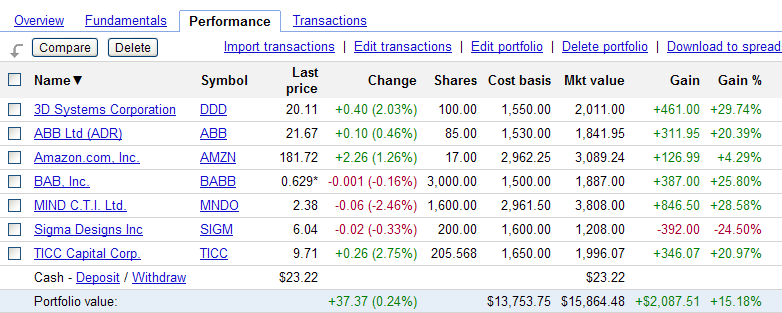
I have listed the companies in my portfolio in alphabetical order by name before doing the screen-grab, as shown by the down-arrow by the Name heading. Portfolio contents can also be listed by symbol, by last price, etc. There are different reasons for listing the contents of a portfolio in different ways.
The screen-grab is of the Performance view. That’s the only view I ever use on my Google Finance portfolios. There are probably excellent reasons why I should be looking at some of the other views from time to time, but I find that the Performance view meets my needs.
Whenever I add a new stock to a Google Finance portfolio I am given the option of entering transaction data, i.e., the number of shares and the price per share. The Performance view then calculates the cost basis for each investment, the market value of each, and the amount and percentage gained or lost on each investment. Gains are in GREEN. Losses are in RED.
You can see, for instance, that I own 200 shares of Sigma Designs (SIGM). The cost basis is $1,600.00. That comes from the fact that I paid $8 per share (200 x $8 = $1,600). At the time that I took this screen-grab, shares of Sigma Designs were $6.04 each. Google has conveniently calculated the amount and percentage lost on that particular investment.
I use a few other Google Finance portfolios to track my various investments. Another portfolio, for instance, consists of several ETFs in which I’m invested through a rollover IRA. Yet another consists of four funds in which I regularly invest through my employer’s 401K program. You get the idea.
The majority of my Google Finance portfolios, though, consist of stocks that I do not currently own, but that I’m keeping under some kind of consideration. I have portfolios named Previous Profit and Previous Loss, for instance, in which I track stocks that I have sold and the price at which I sold them. This is all shear morbid curiosity. These portfolios allow me to see, at a glance, how much my investments in those stocks would be worth if I had NOT sold. I don’t actually look at those portfolios much, though, which is probably for the best.
I look at some of my consideration portfolios a great deal, though. Recently I’ve created two new Google Finance portfolios that I’ve named Cashful Buy and Cashful Sell, and I give those a substantial number of page-views. Here’s a screenshot from Cashful Buy:

Cashful Buy is used to track companies that are both full of cash (that is, they have more cash than debt according to their most recent quarterly reports) and have positive net incomes. They have money, and they’re making more of it. I like that in a company. I don’t actually own any stock in these companies as of this writing, though, so instead of listing multiple shares of each company, I list only 1 share of each, with a cost basis that is essentially an educated fantasy of mine. Google, then, will conveniently list my fantasy price per share as the cost basis for that investment. I won’t have to do the math, then, to try to figure out the price per share at which I wanted to buy when I added it to the portfolio. It’s right there on the page, with convenient gain or loss information as well.
Here’s a screen-grab from Cashful Sell:

Cashful Sell is used to track THE EXACT SAME companies that are in Cashful Buy, however instead of listing fantasy purchase prices for the stocks in question, I have listed fantasy sale prices.
In both cases the prices are meant to be attainable. Likely, even. Possible, at least.
For both screen-grabs, I listed the companies in descending order by percentage gain. For both screen-grabs this left Research In Motion (RIMM) listed at the top of each portfolio. Let us then discuss Research In Motion, the purveyor of the Blackberry mobile device. Here’s yet another screen-grab:

The graph illustrates the fact that it has not been RIMM’s best year ever. The Blackberry used to be the must-have device for the professional on the go. Now the preferred device is an iPhone or perhaps some kind of Android phone. These devices aren’t as secure, perhaps, as the Blackberry, but lately that does not seem to be an issue for most consumers. As a result, RIMM marketshare has waned. The stock has dropped significantly from its 52-week high of $70.54. For the last 3 months RIMM hasn’t been above $20 a share.
If you scroll up and look at the Cashful Buy screen-grab again, you’ll notice that $20 is my fantasy price for RIMM, but since RIMM is, as of this writing, at $17.21 then that fantasy pales in comparison to reality. This is reflected in the Cashful Buy screen-grab. RIMM is the only stock listed in that portfolio that reflects a negative gain.
It’s very useful to be able to tell, at a glance, which stocks, of a group of stocks one is considering, are currently priced below the point at which one might consider purchasing.
If I had any reason to believe that RIMM would regain its marketshare in the near future (or, indeed, ever) then I would be very justified in snapping up some shares. I don't, though. I have some reason to believe that RIMM might recover, but I have no reason to believe that it will.
From what I’ve read, RIMM is biding its time, waiting for a serious mobile-device-security-concern that will drive consumers back to the Blackberry. I suppose such a thing could happen. I’m not sure that it will happen soon, though (or, indeed, at all) and so I have no plan to purchase any shares in RIMM at this time.
From what I’ve read, RIMM is biding its time, waiting for a serious mobile-device-security-concern that will drive consumers back to the Blackberry. I suppose such a thing could happen. I’m not sure that it will happen soon, though (or, indeed, at all) and so I have no plan to purchase any shares in RIMM at this time.
Looking at my Cashful Sell portfolio, then, I can see at a glance that RIMM's current price is 71% below my fantasy sell price, and that this is a greater percentage below the sell price than any other Cashful stock under consideration. Another way of putting this, then, is that RIMM has the greatest potential gain of all of the stocks in that portfolio.
Potential gain isn't guaranteed gain, though, which is why I still have no intention of buying shares of RIMM. Buying RIMM now would be a gamble. A gamble that might, conceivably pay off very well, but also one in which the gambler runs a significant risk of losing all of his bet. The only reason I'm discussing RIMM at such length is because it happens to hold such an interesting position in both of my Cashful portfolios. The potential profit is fascinating, and warrants further attention and study.
We'll discuss methods of further study next week, and we'll continue to use RIMM as our object lesson, unless something much more interesting comes up in the next week or so.
We'll discuss methods of further study next week, and we'll continue to use RIMM as our object lesson, unless something much more interesting comes up in the next week or so.
No comments:
Post a Comment